CO2 Calculator to Support Maritime Trade Sustainability Toolkit
The Carbon Emissions Calculator, which now provides government agencies with access to accurate CO2 emissions data. This can support policy-making to help mitigate and reduce the environmental impact of maritime supply chains.
Initiatives toward sustainable maritime trade in the Asia-Pacific region have been assisted with the development of a “Carbon Emissions Calculator”, which now provides government agencies with access to accurate CO2 emissions data. This can support policy-making to help mitigate and reduce the environmental impact of maritime supply chains.
The Asia-Pacific Economic Cooperation (APEC) launched the calculator earlier this year, enabling ship owners and port operators to determine the volume of CO2 released when transporting cargo between ports in the Asia-Pacific region and North America.
This two-year APEC project was managed by Angelina Ermakov, senior economist with Canada’s Department of Transport. With the calculator available online, APEC member economies’ port authorities, shipping lines and logistics companies will be able to measure CO2 emissions per port and per cargo, adding an important segment of data to the calculation of system-wide performance of gateways and shipping corridors.
Shipping as a growing source of CO2 emissions
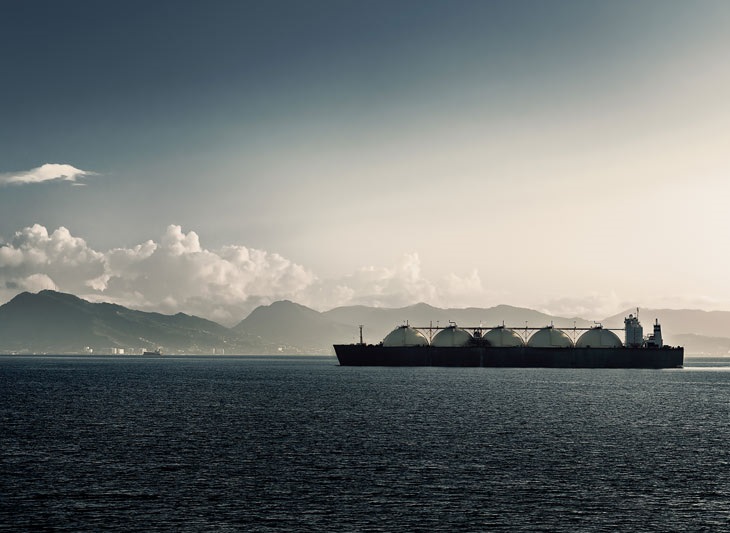
Trans-Pacific maritime trade is a significant contributor to global shipping emissions. The Journal of Commerce (JOC) estimates that over 10 million twenty-foot equivalent unit (TEU) containers arrive in North American ports each month from Asia.
Container shipping is a large — and growing source of CO2 emissions. The London-based International Maritime Organization (IMO) estimates that international shipping contributed 2.7% – or 870 million tonnes – of global CO2 emissions in 2009. Without remedial action, the IMO predicts that could rise to 18% by 2050.
The JOC also observes that intra-Asian container trade is expanding, and may already account for 25 per cent of global container trade.
APEC initiative to tackle rising emissions
The project began in January 2013 as a joint initiative between the APEC Transportation Working Group and the APEC Energy Working Group. The objective of the project was to enable APEC to provide a rigorous, science-based tool to member economies to assist them in reducing CO2 emissions from the ocean-going vessels. In 2011, APEC economies committed to reducing aggregate energy intensity by 45 per cent by 2035.
The calculator aimed to improve on existing shipping industry CO2 calculators by using fuel data from each voyage, and allocating CO2 emissions based on the type of ship and the actual ports visited. It was also designed as a practical online tool to help transport companies identify ways to lower fuel costs.
Although the mathematical formulae in the calculator are extremely complex, the tool is very easy to use. It can be downloaded online and used without formal training by port employees, government policy-makers and academic researchers.
From kick-off in early 2013, the emissions calculator project was an APEC-wide collaboration in which Transport Canada worked with experts from China’s Ministry of Transport, Korea’s Ministry of Trade, Industry and Energy of Energy, and the United States’ Office of Policy and International Affairs. Managers from the Port of Ningbo, China, and the Prince Rupert Port Authority, Canada, provided technical advice on port operations.
Gaining top-level shipping industry advice and support from operators was essential toward achieving its objectives.
As the shipping industry was brought on board early in the project, the team of experts from APEC economies made sure the tool functioned in a way that commercial operators would find useful. The industry and port operators gave direct insights into how port authorities and ship owners manage maritime trade, helping to ensure that the calculator would add value in a commercial environment.
Grow trade and increase efficiency
The team of experts representing the APEC economies, as well as researchers from Global Spatial Technology Solutions Inc. (GSTS), a Canadian company that won the bid for this work, started with development of a method for accurately measuring emissions on busy trans-Pacific shipping routes.
Existing formulae for calculating shipping emissions were not sufficiently accurate as they discounted the fact that ships make multiple stops to load and discharge cargoes throughout several ports on a voyage, which is a common practice on trans-Pacific routes.
Three key stakeholder groups were identified as critical to the success of the initiative: port authorities, ship owners and ship operators. If the projected emissions calculator satisfied their data needs, it would ultimately help optimize shipping patterns towards more efficient operations.
Each potential user group has a reason to ensure marine shipping is as efficient as possible. For example, ship owners want the ability to vary inputs to see which combination of loads and stops minimizes fuel consumption. Port authorities want to supply their logistics company customers with reliable emissions data to enhance competitiveness, as well as contribute to their efforts to improve local air quality.
“Game theory” on the high seas
To build the calculator, the APEC Transportation Working Group and Energy Working Group partnered with GSTS, with Transport Canada providing the project oversight, to develop a methodology that allocates emissions per cargo and per port, to build an online tool/application, using inputs (such as actual distance travelled and actual speed) obtained from satellite tracking data, as all ocean-going vessels are equipped with on-board transponders sending real-life voyage data to satellites.
The key principles used for the allocation of emissions were taken from the “Game Theory” which is often applied in the transportation industry to determine costs for multiple users of a shared resource, for example in calculation of landing fees at an airport. For this particular project, similar principles were applied to break down the total amount of CO2 emissions produced by the vessel on the entire voyage per each TEU transported between specific ports on trans-Pacific routes. This approach to allocate emissions per each TEU makes the outcomes of the APEC project truly unique. For the first time, the shipping industry has a method for accurately allocating emissions per cargo and per port.
The calculator was subsequently refined and completed in February 2015. The Windows-compatible application prompts the user to input cargo volumes in multiples of ten-foot containers, the ports between which the cargo was carried, and the actual fuel stamp – or fuel consumption – for the voyage. The calculator then generates a figure for the CO2 emitted per TEU for the voyage.
Lower fuel costs per container movement
The calculator establishes an APEC-accepted benchmark for allocating CO2 emissions, which has a commercial benefit across the Asia-Pacific region.
By adopting a widely accepted allocation method, logistics companies can attract customers who seek efficient and environmentally responsible service providers, while at the same time helping improve air quality for residents in port cities such as Hong Kong, Shanghai and Singapore by reducing demand for un-economic ship movements.
With accurate, openly available data, APEC economies can evolve greener supply chains and reduce regional energy intensity, which means that greater efficiency and lower emissions do not just improve trade within APEC—but also improve the quality of trade.